Tutorial
- What is iMKT?
- General help
- About this tutorial
- How can I upload and analyze my own data?
- Criteria to select an MKT method depending on your data and question(s) at hand
- Are the selective regimes of the X chromosome different when comparing ancestral vs colonizing Drosophila populations?
- Do genes located in regions of high recombination undergo adaptive evolution?
- Can I perform these anayses locally? Continuing your analyses with the iMKT R package
- Need more help?
- Cite us!
What is iMKT?
iMKT (acronym for integrative McDonald and Kreitman test) is a web-based service performing four types of McDonald and Kreitman tests (MKT). It allows the detection and estimation of four selection regimes (adaptive, neutral, strongly deleterious and weakly deleterious) acting on protein-coding DNA sequences. The added value of this tool is threefold. First, four MKT, two of which were not previously available as open software packages, can be performed at once. Second, it provides a simple interface to analyze user’s own population genomic data. Third, taking advantage of the copious information gathered in our previous population genome browsers, PopFly and PopHuman, it offers a fast tool to estimate the different selective regimes on thousands of Drosophila and human protein-coding genes on several worldwide populations.General help
The server is divided into four main sections which are accessible through the Home page and the top navigation bar:
- MKT analysis: it allows analyzing the user's own population genomics data and estimating four selective regimes by applying four different MKT methodologies.
- PopFly data analysis: it allows analyzing the selective regimes of 13,753 protein-coding genes in 16 populations of D. melanogaster by using the data collected in PopFly Also, it allows performing statistical analyses by comparing different lists of genes to answer complex population genetics hypotheses.
- PopHuman analysis: it allows analyzing the selective regimes of 20,643 protein-coding genes in 26 human populations by using the data collected in PopHuman. Also, it allows performing statistical analyses by comparing different lists of genes to answer complex population genetics hypotheses.
- Help and tutorial: this resource will guide you through the iMKT site through a step-by-step worked example.
About this tutorial
iMKT is designed to help testing evolutionary hypotheses from a population genetics perspective. Below are some examples of questions that can be answered using iMKT which will guide you in the usage of this web service.How can I upload and analyze my own data?
1. Polymorphism and divergence data
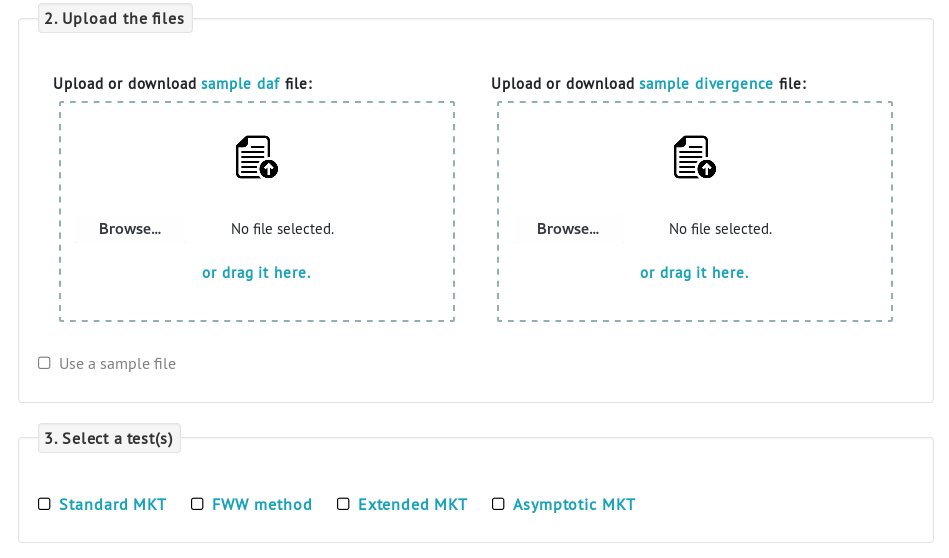
iMKT provides a simple form in the MKT analysis page that allows the analysis of user's own data from polymorphism and divergence data.The form consists of three parts. First, the user has to select the input data type (in this case, polymorphism and divergence). Second, the required files need to be uploaded: a file containing the polymorphism information and a file containing the divergence data. Third, select an MKT test.
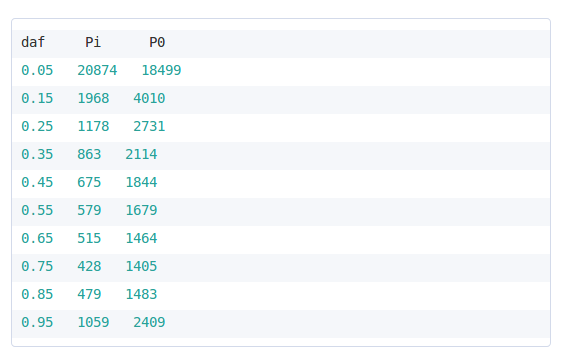
Divergence allele frequency (DAF) input sample file. The file is a tab-delimited with named columns for the DAF frequency (daf), the total number of non-synonymous polymorphic sites (Pi) and the total number of synonymous polymorphic sites (P0) in each frequency. The SNP frequency can be divided into different derived allele frequency classes (the example shows 10 different frequency bins). Choose a number of bins that limit the empty frequency cells.
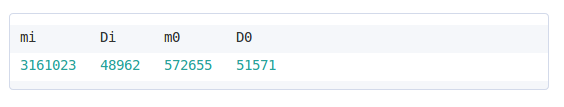
Divergence input sample file. The file is a tab-delimited with named columns for the total number of non-synonymous analyzed sites (mi), the total number of divergent non-synonymous sites (Di), the total number of synonymous analyzed sites (m0) and the total number of divergent synonymous sites (D0).
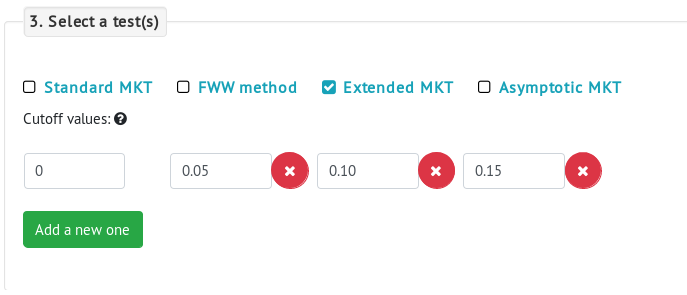
Selecting a MKT method
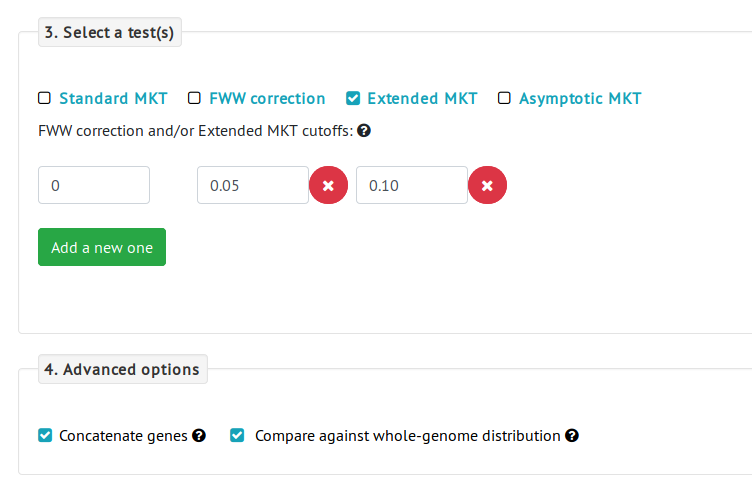
There are four MKT methods available: the standard MKT, the FWW method, the Extended MKT and the asymptotic MKT. The extended and FWW MKT share an additional parameter: the cuttoff below which polymorphism data will be removed. The user can easily add more cuttofs by clicking in the Add a new one button. The asymptotic MKT also has an additional parameter: the polymorphism frequency interval that will be used to estimate α. This is used to remove both low-frequency polymorphisms which can have higher error rates due to sequencing errors, and high-frequency polymorphisms which might be affected by polarization errors.
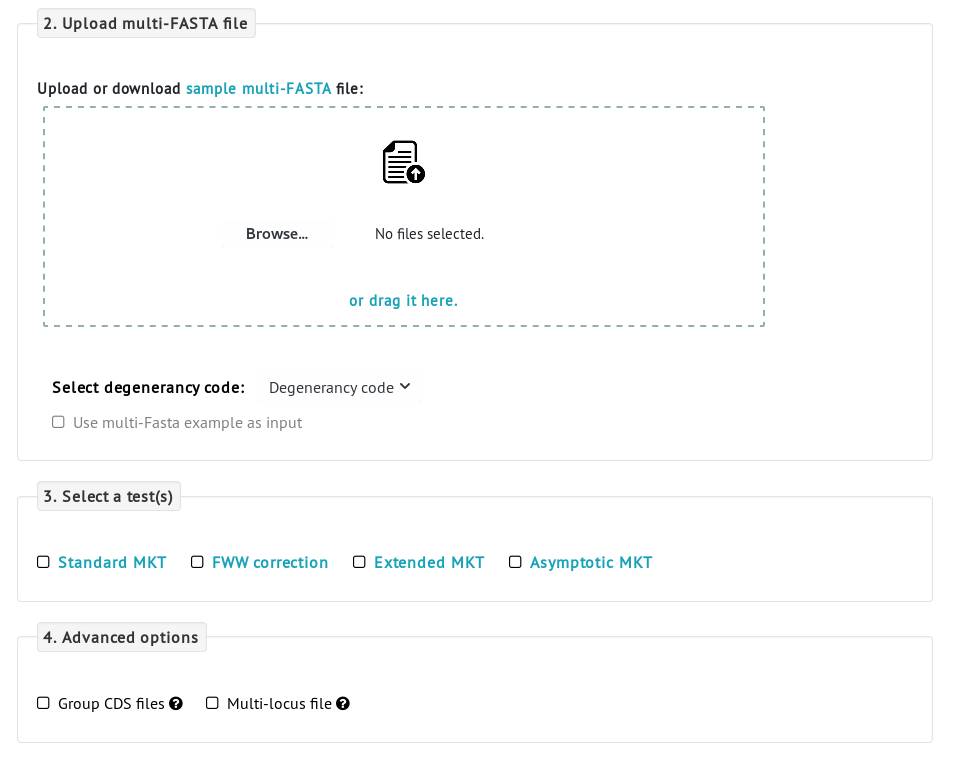
2. Multi-FASTA analysis
The iMKT server also accepts multi-FASTA alignments as input. In this case, click the multi-FASTA switch as the input data type. Polymorphism and divergence data will be estimated on putatively neutral (4-fold degenerated) and putatively selected (0-fold degenerated) sites. Then, choose any MKT methodology.
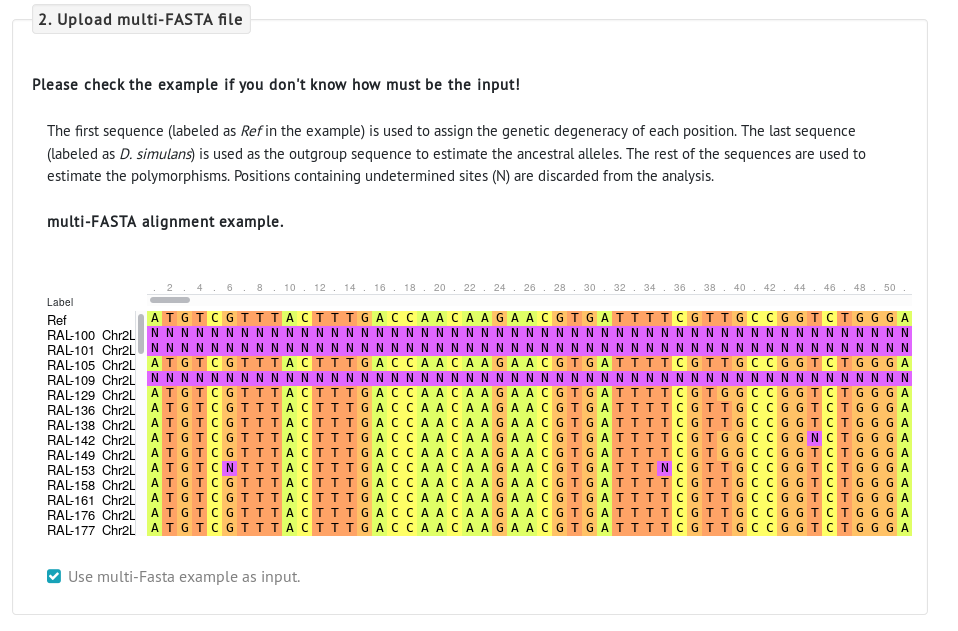
These are the requirements of the multi-FASTA files:
- Sequences need to be protein-coding sequences (CDS) and aligned.
- The first sequence in the file is the reference sequence , which will be used to compute the degeneracy of each nucleotide position.
- The last sequence in the file is the outgroup sequence , which will be used to compute divergence data and infer the ancestral alleles.
- Any other sequences between the first and the last sequence are considered polymorphic sequences , which will be used to compute the Derived Allele Frequency of polymorphic sites. At least two sequences are needed.
You can see an example of a multi-FASTA file by clicking the option Use multi-FASTA example as input.
More than one multi-FASTA files can be uploaded. In this case, you can use some advanced options to perform more complex analyses. For example, the option Concatenate CDS files will perform an MKT for each file separately, and an additional MKT for the concatenated data of all uploaded files. Alternatively, if you already have a multi-FASTA file containing several concatenated loci, you can select the option Multi-locus file to input a single line with the coordinates of all loci in the alignment.
If you don't know how to extract CDS data from genomic alignments or process the DAF, we provide this Python script as well as public data corresponding to the Drosophila Genome Nexus and FlyBase reference sequence. Check the help option () to learn about the required inputs.
The Derived Allele Frequency (DAF) polymorphism data and divergence estimations computed by iMKT server will be available for download from the final report.
Criteria to select an MKT method depending on your data and question(s) at hand
Here are some basic guidelines that can help you choose an MKT methodology depending on your data and questions at hand:
- If single-gene data is used, the asymptotic method (aMKT) is usually not applicable, since aMKT requires a high volume of polymorphic data to fit the asymptotic function. In this case, you can either use the FWW method, the extended MKT (eMKT) or standard MKT.
- aMKT is usually appropriate when multiple genes are concatenated.
- The choice among standard MKT, FWW method or eMKT will depend on whether you want to remove and/or quantify negative selection. For data unaffected by negative selection, the standard MKT can be used. Both FWW MKT and eMKT remove negative selection, but only the latter allows its quantification. Furthermore, the FWW method discards more data than the eMKT.
Are the selective regimes of the X chromosome different when comparing ancestral vs colonizing Drosophila populations?
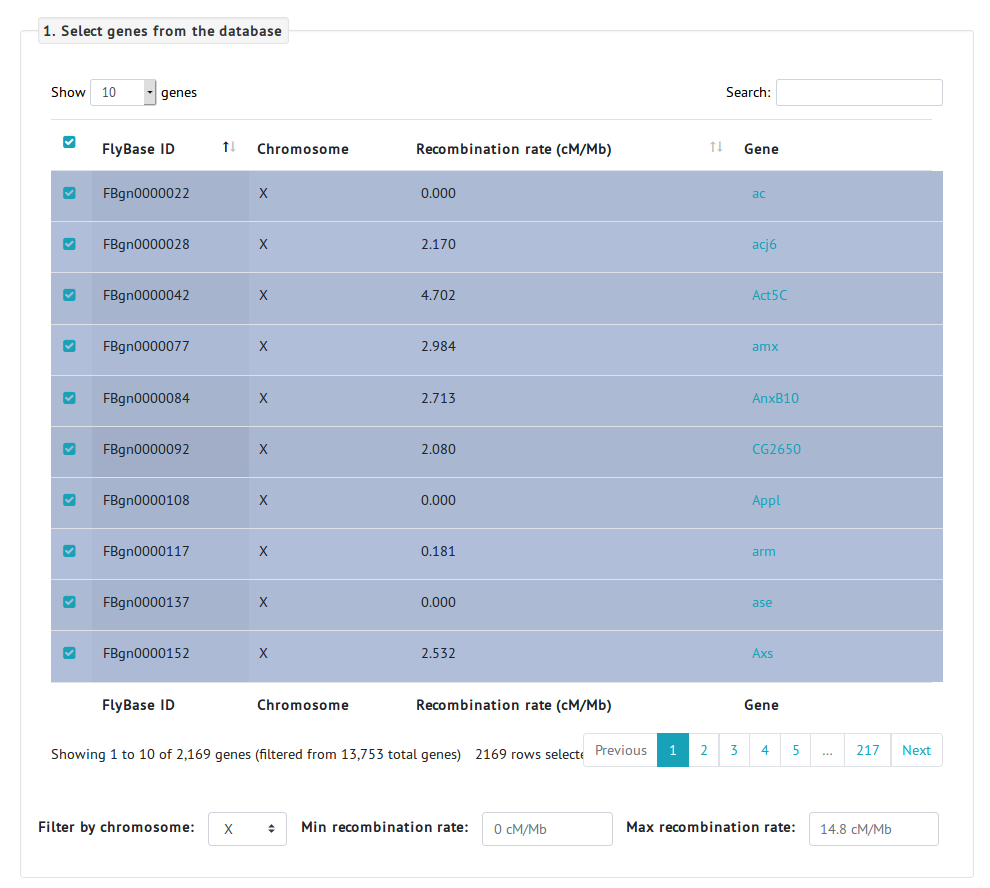
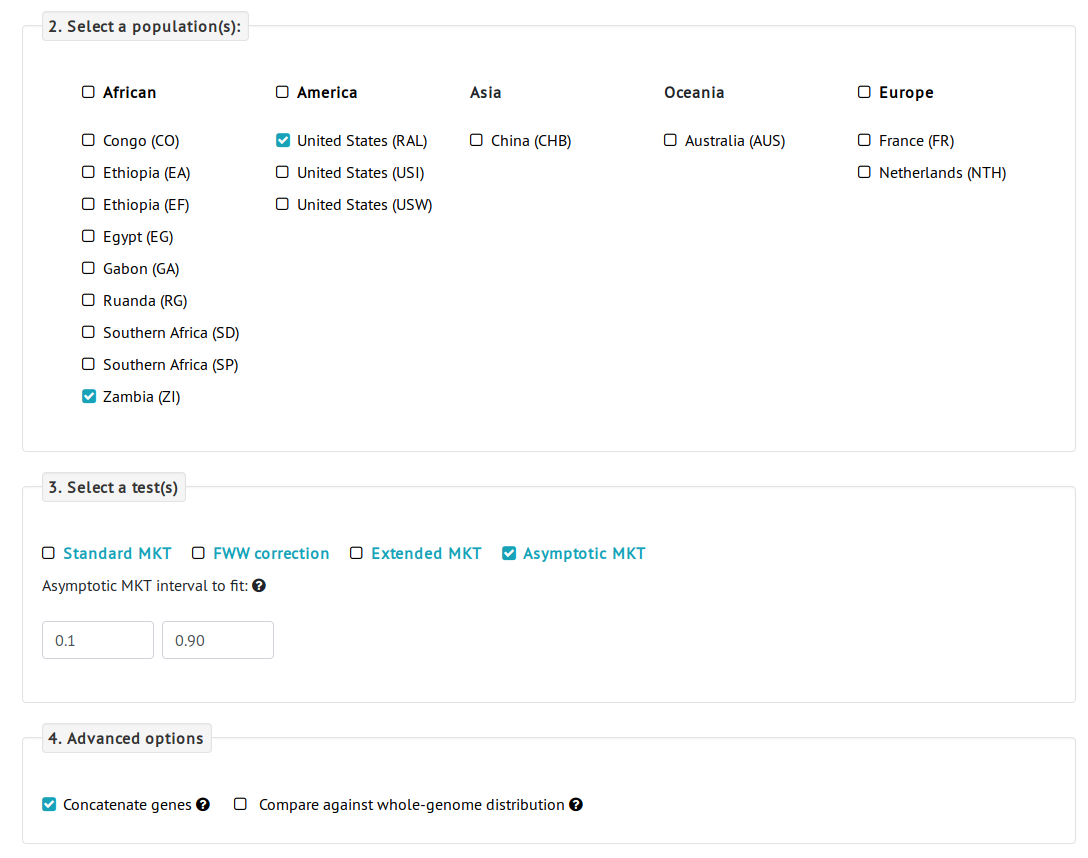
To answer this question, we navigate to the PopFly analysis page.- First, we need to select the genes to be analyzed. Because we are interested in the evolution of the X chromosome, we can use the Filter by chromosome option and select all the genes located in the X chromosome. We can select all the rows (a total of 2,169 protein-coding genes of the X chromosome) by checking the first checkbox of the table.
- Next, we select the different populations. Because we are interested in the comparison of ancestral and colonizing populations, we select the Raleigh (RAL) population from North America, and the Zambia (ZI) population from Africa, as a colonizing and an ancestral population, respectively.
- Finally, we need to choose an MKT test. Given that we are going to analyze a large number of genes altogether, we can use the asymptotic MKT, which will give a less underestimated α. For the purpose of this analysis, we concatenate genes, i.e., analyze all the selected genes altogether, as we are not interested in the selection estimates of individual genes but in the global pattern of X-specific genes.
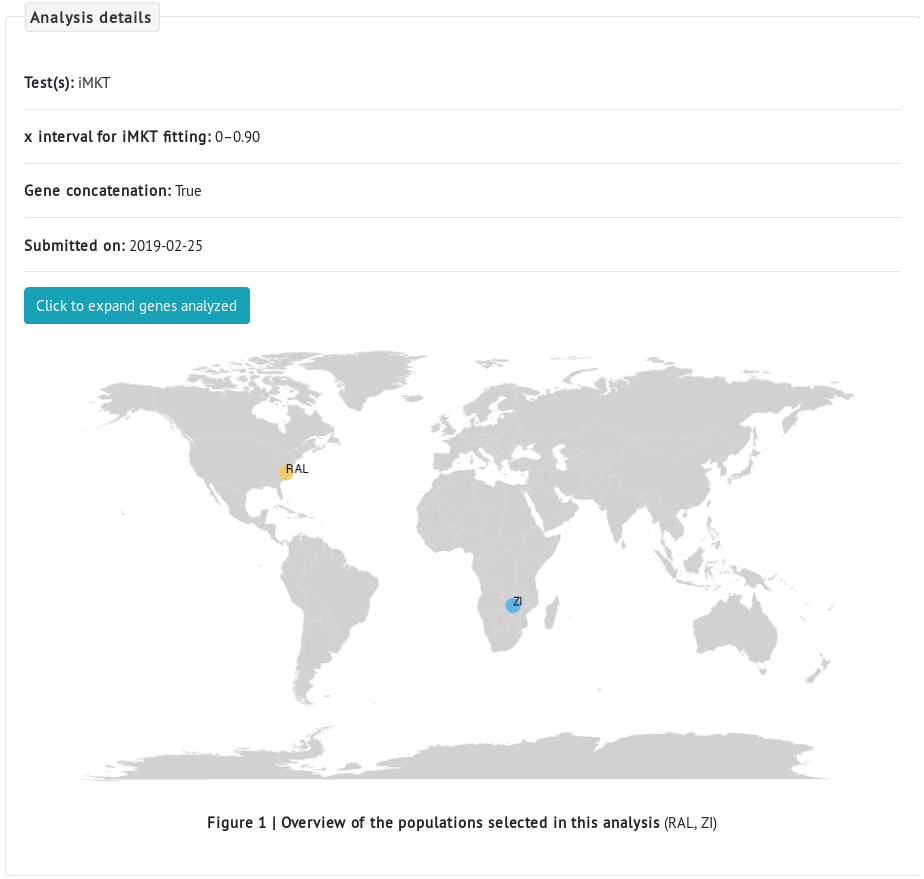
- After submitting the query, results are displayed in a complete report, which is divided into different sections.
- First, details of the analysis show the selected test(s), whether the data was concatenated or not, the parameters used for the test(s) (if any), the populations selected, and the number of genes analyzed.
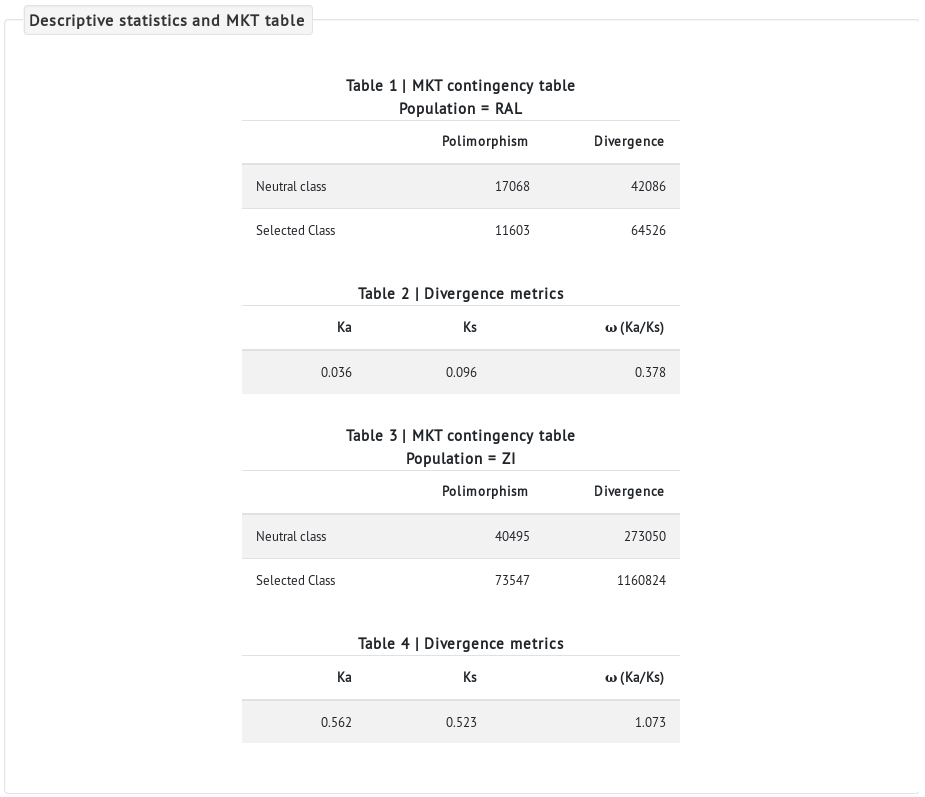
- The next section displays a summary of the MKT tables and descriptive statistics for each population analyzed. We can see that the African population (ZI) has much more nucleotide variation in both polymorphic and divergent sites than the North-American population (RAL) (compare the values in Tables 1 vs 3, and 2 vs 4) as expected, since the African population is the ancestral one.
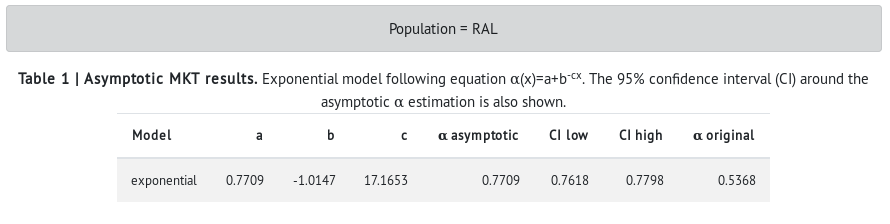
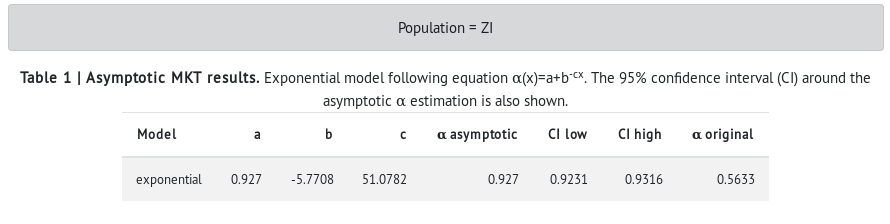
- Finally, the next section shows the results of the selected MKT test.
- In the table, values of the exponential model are shown (a, b, c). Then, the asymptotic α is shown with the 95% confidence interval (CI) around it. The α estimated with the standard MKT is also shown for comparison.
- The results show that the African (ZI) population has a higher proportion of adaptive divergence in the X-linked genes than the North-American population (RAL) (see alpha asymptotic in RAL vs ZI). However, the difference is only very slight in the α estimated with the standard MKT (α original). These results are in agreement with what the population genetics theory predicts: large populations (i.e., ancestral populations) harbor more genetic variation and a more effective natural selection. Also, the standard MKT underestimates the estimated proportion of adaptive divergence (i.e., α original).
Do genes located in regions of high recombination undergo adaptive evolution?
To answer this question, we navigate to the PopFly analysis page.- First, we need to select the genes to be analyzed. Because we are interested in the evolution of genes located in regions of high recombination, we can use the Min recombination rate option. We set this option to 7cM/Mb and select all the rows (a total of 475 protein-coding genes located in regions that harbor a recombination rate higher than 7cM/Mb, according to Comeron et al., 2012) by checking the first checkbox of the table.
- Then we select an MKT test. In this case, the number of genes selected is lesser than in the previous example and it might be not enough for an asymptotic MKT, so we select the Extended MKT method.
- Finally, we check the option Compare against whole-genome distribution, which will compare the distribution of the selected 475 protein-coding genes against the distribution of all D. melanogaster protein-coding genes.
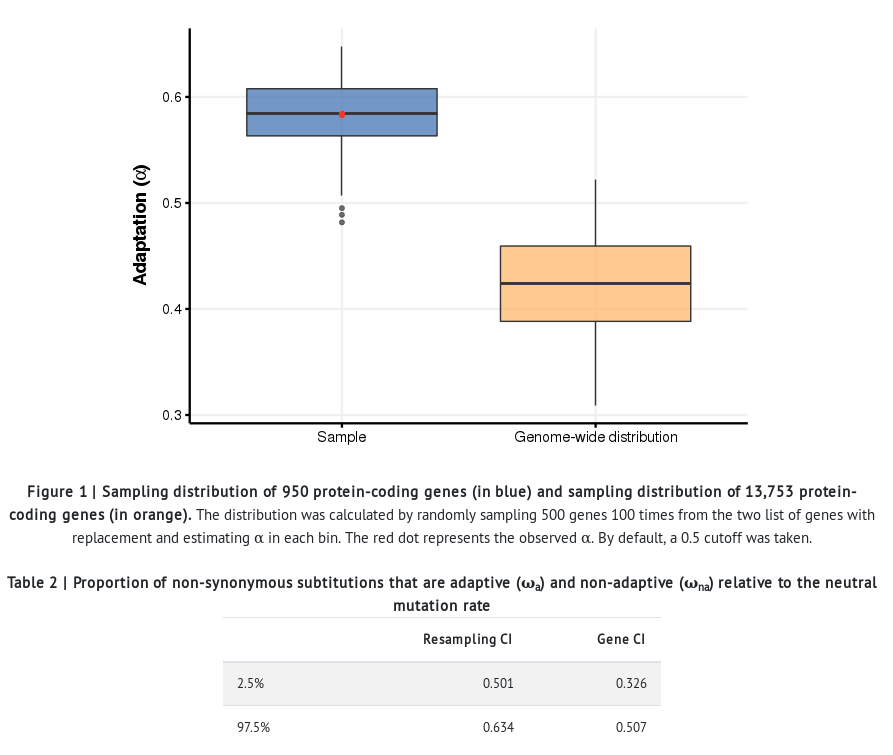
- In addition to all the sections described in the previous example, the resulting report provides the distribution of α estimates in both the group of genes located in regions of high recombination and all the genes in the Drosophila genome. The significance of the differences among groups is assessed by comparing the confidence intervals (CI).
- The results of this analysis show that genes located in regions of high recombination harbor a much higher proportion of adaptive divergence (α) than the general genome-wide distribution. Natural selection is more effective in regions of the genome of high recombination, while it is impeded by the Hill-Robertson effect in regions with low levels of recombination.

Can I perform these anayses locally? Continuing your analyses with the iMKT R package
It is possible to perform and reproduce all the analyses provided in iMKT web server in an automated way. Visit the R package section to learn how to install it and use it.Need more help?
If you have questions, encounter problems or have suggestions, please do not hesitate to write us through this contact form.Cite us!
Please cite this reference for results obtained with iMKT: Jesús Murga-Moreno, Marta Coronado-Zamora, Sergi Hervas, Sònia Casillas, Antonio Barbadilla (2019) iMKT: the integrative McDonald and Kreitman test. Nucleic Acids Research, Advance access gkz372 (https://doi.org/10.1093/nar/gkz372).We have noticed a typo in the asymptotic MKT formula of our publication. The exponential function should read αfit(x)=a+b×e-cx (the e of the exponential is missing).